
What is Graphout
Graphout lets you query graphite or prometheus, then forward the results to different external services. Like Zabbix or StatusPage.io custom metrics.
The project considered BETA, however everything should work. Submit issues and/or suggestions. Pull requests are always welcome.
Why?
Graphite collects metrics, this is very cool, but how can I make use of these metrics? And not just
for visualizing them. What if I have a central monitoring system like Zabbix, that responsible to
send alerts, and I want to alert based on Graphite data? Or what if I want to do AWS Auto-scaling
based on graphite data? How can I get this data into CloudWatch? I’m sure you have your own reasons
to get this data out of Graphite to some external tool or service.
So, I decided that I need something that can answer the above questions. This is how Graphout was started. :muscle:
Features
- Can take any query from Graphite render API
- HTTPS and HTTP basic authentication
- Average, maximum and minimum calculation (per output)
- Filter queries (per output)
- Log, Zabbix, CloudWatch and StatusPage.io outputs
- New output modules very easy to write
- New, support for Prometheus as query source
- Docker image available in the DockerHub
Future work
- Allow set interval per query
- Write unit tests (help needed)
- Create Upstart and Systemd service scripts
- Nice to have: prepare a
puppetmodule
Quick start guide
Install
# npm install --global graphout
Usage
# graphout --help
usage: graphout --config <config-path> --pid <pid-path> [-v]
Run
- download example configuration, and save it to
/etc/graphout/graphout.json - change the configuration to meet your graphite settings
- make sure the example query will work on your environment, if not change it
- Now, you can run Graphout
graphout --pid /tmp/graphout.pid --config /etc/graphout/graphout.json
Result
If all good, you should see data goes to a log file (/tmp/logoutput.log) written
by the logoutput module. If not, try to set log_level to debug in configuration or post your issue(s)
and I’ll try to help you getting started.
Configuration
Configuration is a typical JSON file(s), with one addition that you can have comments in it.
Also you can include configuration files from master config. See include option.
The configuration file(s) validated using JSON schema, invalid configuration properties will cause Graphout to exit immediately.
Read the schema for the accepted configuration format.
Query engines
Starting from Graphout version 0.4.0, there is support for query engines. Which allows to use query source other than graphite. Currently prometheus query engine supported in addition to graphite.
Graphout allows to use single query engine per configuration. Which means you can’t use graphite and prometheus together. Thus you have to specify which query engine you want to use.
Minimal configuration
Note: by default Graphout uses
graphitequery engine.
graphite_urlis mandatory- at least one
querymust be configured - at least one
outputmust be configured
Example
{
    "graphite_url": "http://graphite.example.com:8080",

    "queries":
    {
        "go-carbon.updateOperations":
        {
            "query": "sumSeries(carbon.agents.*.persister.updateOperations)",
            "from": "-1min",
            "until": "now"
        }
    },

    "outputs":
    {
        "logfile":
        {
            "output": "./logoutput",
            "params": {
                "path": "/tmp/logoutput.log"
            }
        }
    }
}
Available configuration options
query_engine
Which query engine to use when executing queries, one of graphite or prometheus, default is graphite.
graphite_url/prometheus_url
URL to the graphite-web or prometheus-api. The option must conform to the URI format.
graphite_auth/prometheus_auth
HTTP basic authentication option in <username>:<password> format, optional.
interval
Query interval in seconds, default is 60 seconds
log_file
Full path to the log file, default is /var/log/graphout/graphout.log.
Set this to /dev/stdout to print to console.
log_level
Minimal log level that will be printed, default is info.
Available levels are: error, warn, info and debug.
splay
Delay each query by consistent random of seconds.
If enabled, delay between 1 second and the query interval. Default is false
include
The include option is a list of configuration files to load. The files are loaded and merged in the specified order.
Each include element can have glob based wildcards.
Example:
"include": ["/etc/graphout/conf.d/*.json", "/etc/graphout/example.json"]
queries
Query objects, for graphite or prometheus.
For graphite, the format is:
// Alphanumeric unique query name, with dots and hyphens allowed.
"go-carbon.updateOperations":
{
    // the graphite target
    "query": "sumSeries(carbon.agents.*.persister.updateOperations)",

    // relative or absolute time period
    "from": "-1min",

    // relative or absolute time period
    "until": "now",
}
For more information about the query (target), from and until options, read the
Graphite Render URL API manual.
Note that, Graphout uses the maxDataPoints API option,
to return 60 consolidated data points at most. The maxDataPoints option available since Graphite 0.9.13.
So it’s best that you have the latest version of graphite-web.
For prometheus, the format is:
// Alphanumeric unique query name, with dots and hyphens allowed.
"prometheus_cpu.5m.avg":
{
    // the prometheus instant-query
    "query": "sum(irate(node_cpu{role='prometheus', mode!='idle'}[5m])) * 100",

    // time=<rfc3339 | unix_timestamp>: evaluation timestamp, optional.
    "time": ""
}
For more information about the query (instant-query) and the time options, read the
Prometheus HTTP API manual. Currently Graphout supports only vector result types. Open feature request, if you need the matrix type as well.
outputs
Output objects. The format is:
// Alphanumeric unique output name
"logfile":
{
    // ouput module name, Graphaut will use "require" to load the module
    "output": "./logoutput",

    // filter can be used to process only matched queries (using regular expression)
    // default: all queries are processed by the outputs.
    "filter": ".*",

    // the calculation method of the values received from query_engine
    // available methods: "avg", "min", "max"
    // default: "avg"
    "calculation": "avg"

    // "params" properties are specific to the "output" module
    "params": {
        "path": "/tmp/logoutput.log"
    }
}
Outputs configuration
Each output is a Node.js module. The only exception is a built-in logoutput output, which is part of this project.
The other currently available outputs are CloudWatch, Statuspage.io and Zabbix they are separate packages. Those outputs are dependencies
of this project, so they’re installed automatically when you install Graphout.
logoutput
The only param for this output is path, to the log file where all queries results will be written to.
Documentaion of supported outputs:
- CloudWatch output
- StatusPage.io output
- Zabbix output
Custom outputs
Custom outputs are very easy to write. You just write a function that accepts 3 arguments.
Inside your function you listen to upcoming events and process them as you desire.
Just take a look at the logoutput output as an example.
Function arguments
events(EventEmitter), where all the events will be sent to.logger, the logger where you can send your logs to.params, the output parameters, all the parameters that were passed to the output module (read above about outputparams)
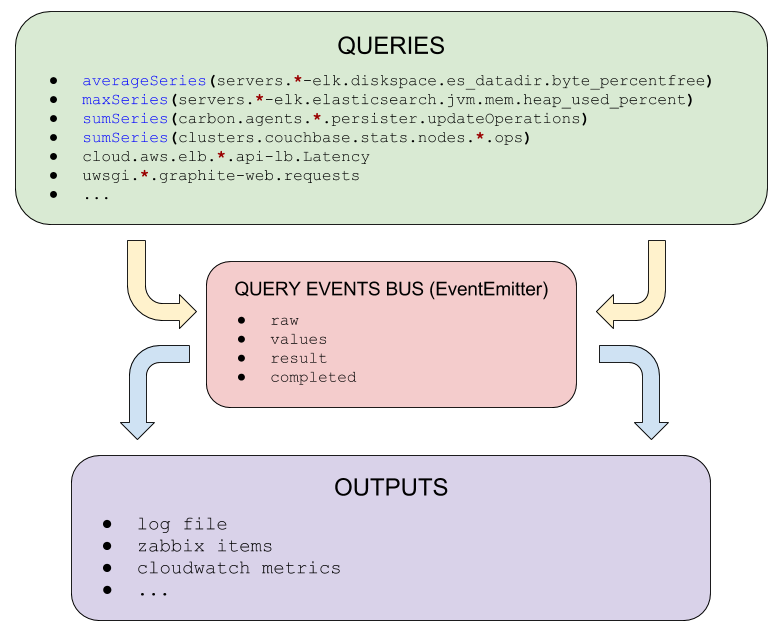
Available events
raw
A very first event which includes exactly same data as it was retrieved from the query_engine, as JavaScript Object.
Two arguments passed to the event, first is the raw data, second is the query options object.
values
The values array of the query, which still not passed any calculation. (nulls are omitted)
Two arguments passed to the event, first is the values array, second is the query options object.
result
The calculated result, after calculation of avg, min or max. Depends what was requested in the query options.
Two arguments passed to the event, first is the result value, second is the query options object.
Internal architecture
License
Licensed under the MIT License. See the LICENSE file for details.